

Hier zeige ich dir, wie du in Home Assistant mit InfluxDB eine Langzeitdatenspeicherung aufbauen kannst. Anschließend schauen wir uns noch an, wie du diese Daten mit Grafana analysieren und in wunderschönen Dashboards & Panelen darstellen kannst 🙌
Dabei habe ich, zumindest sowie ich das beurteilen kann, keine Wünsche offen gelassen, was grundlegende Benutzung, aber auch die erweiterte Panelerstellung in Grafana anbelangt 🚀
Hinweis (Stand Oktober 2026): Das Video ist von 2023. Seitdem hat sich einiges getan: Add-ons heißen seit Home Assistant 2026.2 Apps, die InfluxDB-Integration richtest du seit 2026.3 über die Oberfläche ein, und die InfluxDB-App heißt jetzt „InfluxDB v1“. Die Einrichtung findest du deshalb hier im Beitrag noch einmal Schritt für Schritt auf aktuellem Stand. Der Grafana-Teil aus dem Video funktioniert vom Prinzip her genauso, einzelne Menüs in Grafana sehen inzwischen aber anders aus.
InfluxDB, Recorder & Langzeitstatistik: Was ist was?
Bevor es losgeht, kurz zur Einordnung, weil hier gerne einiges durcheinander geht:
- Recorder (Verlauf): Home Assistant speichert jede Zustandsänderung in seiner eigenen Datenbank, standardmäßig aber nur 10 Tage. Diesen Wert stark hochzudrehen ist keine gute Idee, weil die Datenbank dann groß und langsam wird.
- Langzeitstatistik: Für Sensoren mit Zustandsklasse (z.B. Temperatur, Leistung, Zählerstände) legt Home Assistant zusätzlich Stundenwerte an und behält die dauerhaft. Darauf bauen das Energie-Dashboard und die Statistik-Karte auf. Für viele Auswertungen reicht das schon. Wenn dort mal ein Ausreißer drin ist: Statistiken in Home Assistant korrigieren.
- MariaDB: Ist nur ein anderer Datenbank-Unterbau für den Recorder, also kein Ersatz für InfluxDB. Mehr dazu: In Home Assistant MariaDB installieren.
- InfluxDB: Eine zweite Datenbank, die parallel zur Home-Assistant-Datenbank läuft und sie nicht ersetzt. Sie speichert die Zustände der Entitäten, die du auswählst, in voller Auflösung und so lange, wie du willst. Und zwar ab dem Zeitpunkt der Einrichtung, rückwirkend gibt es nichts.
- Grafana: Das Werkzeug, mit dem du die Daten aus InfluxDB abfragst und in Dashboards darstellst.
Voraussetzungen
Home Assistant muss bereits installiert sein. Für die Apps brauchst du Home Assistant OS, bei einer Container-Installation müsstest du InfluxDB und Grafana als eigene Container betreiben.
Bei der Hardware solltest du nicht zu knapp planen: InfluxDB ist eine zweite Datenbank, die ständig schreibt. Einen Raspberry Pi 3 würde ich dafür nicht nehmen, ein Raspberry Pi 4 geht, aber nur mit angeschlossener SSD, sonst ist die SD-Karte irgendwann hinüber. Besser ist ein (gebrauchter) sparsamer Mini-PC, da steckt ohnehin eine SSD drin.
Vorgestellte Apps
- InfluxDB (im App Store als „InfluxDB v1“)
- Grafana
Kurzer Hinweis in eigener Sache
Viele hätten vermutlich für ein Video diesen Umfangs & dieser Art einen Kurs auf Udemy oder Masterclass gemacht. Für die Erstellung habe ich mich mehrere Wochen intensiv mit dem Thema Grafana außeinandergesetzt… Und das alles in meiner Freizeit.
Ich bin ein Fan von freien Informationen, würde mich aber auch über Unterstützung freuen, wenn du es dir leisten kannst.
Falls sich das nach einer Option für dich anhört, kannst du gerne mal hier vorbeischauen: https://www.buymeacoffee.com/simon42official
Besten Dank im Voraus 🎉
InfluxDB
InfluxDB-App installieren
Einstellungen → Appsöffnen und unten rechts in den App Store wechseln.- Nach InfluxDB suchen und die App InfluxDB v1 öffnen. Sie kommt aus dem Community-Repository, das schon eingebunden ist. Alternativ springst du über diesen My-Home-Assistant-Link direkt hin.
- Auf Installieren klicken.
- Auf der Info-Seite die Schalter setzen. Im Video habe ich alles aktiviert, ob du automatische Updates willst, entscheidest du selbst.
- Noch nicht starten, erst die Konfiguration aus dem nächsten Abschnitt eintragen.
Konfiguration der App
Kommt unter envvars im Reiter Konfiguration der App. Damit schaltest du die interne Monitoring-Datenbank von InfluxDB ab, die du für Home Assistant nicht brauchst und die sonst nur zusätzlich mitschreibt:
- name: INFLUXDB_MONITOR_STORE_ENABLED
  value: "false"
Speichern, dann auf dem Reiter Info die App starten und im Protokoll nachschauen, ob sie sauber hochfährt.
InfluxDB v1, 2.x oder 3?
Hinweis (Stand Oktober 2026): Die App liefert InfluxDB 1.x (aktuell 1.13.1) zusammen mit der Weboberfläche Chronograf und Kapacitor, nicht InfluxDB 2 oder 3. Deshalb heißt sie seit Version 6.0.0 auch „InfluxDB v1“. Ende August 2026 wurde die App kurzzeitig als End-of-Life markiert und aus dem Store genommen, wer sie installiert hatte, bekam eine Reparaturmeldung. Seit Mitte September ist sie wieder im App Store und wird wieder gepflegt.
Die Home-Assistant-Integration kann neben 1.x auch in InfluxDB 2.x und InfluxDB 3 (Core/Enterprise) schreiben. Das ist interessant, wenn du InfluxDB sowieso schon woanders betreibst, zum Beispiel auf einem eigenen Server. Dann wählst du bei der Einrichtung „InfluxDB v2.x / v3“ und gibst Organisation, Bucket und Token an. Bei InfluxDB 3 funktionieren Flux-Abfragen nicht. Alles in diesem Beitrag, inklusive der Grafana-Dashboards weiter unten, bezieht sich auf InfluxDB 1.x mit InfluxQL.
Datenbank und Benutzer anlegen
Öffne die Weboberfläche der App (über die Seitenleiste oder Benutzeroberfläche öffnen). Das ist Chronograf. Links findest du InfluxDB Admin:
- Reiter Databases → Create Database und als Namen
home_assistanteingeben. Genau so geschrieben, das ist auch der Name, den Home Assistant vorschlägt. - Die Retention Policy autogen mit unendlicher Dauer lässt du am besten so. Die Datenbank wächst damit zwar über die Zeit, InfluxDB ist aber recht sparsam, auf einer SSD reicht der Platz in der Regel für viele Jahre. Wenn du die Dauer begrenzen willst, ändere die Duration von autogen direkt am Anfang (z.B.
1000d) und leg keine zusätzliche Policy an, sonst wird die Verbindung mit Grafana unnötig kompliziert. - Reiter Users → Create User: Namen vergeben (im Video
hainfluxuser), ein sicheres Passwort ausdenken, anlegen und bei Permissions „ALL“ setzen.
Die Daten liegen in der App und landen damit auch in deinen Home-Assistant-Backups, die wachsen also mit. Mehr dazu: Home Assistant Backup & Restore.
Home Assistant mit InfluxDB verbinden
Seit Home Assistant 2026.3 richtest du die Verbindung über die Oberfläche ein. Benutzername und Passwort gehören nicht mehr in die configuration.yaml.
Einstellungen → Geräte & Dienste → Integration hinzufügenund nach InfluxDB suchen.- Als Version InfluxDB v1.x auswählen.
- URL:
http://a0d7b954-influxdb:8086(das ist der interne Hostname der App). - Benutzername und Passwort: der Benutzer, den du gerade in Chronograf angelegt hast.
- Datenbank:
home_assistant. - Absenden. Kommt ein Fehler, stimmen meistens Benutzer, Passwort oder der Datenbankname nicht.
Filter, Tags & Co. in der configuration.yaml
Welche Entitäten in InfluxDB landen und wie sie dort abgelegt werden, legst du weiterhin per YAML fest. Richte dafür zuerst die Integration wie oben ein und ergänze erst danach den Block. Findet Home Assistant beim Start einen influxdb:-Block, aber noch keine eingerichtete Integration, versucht es, die Verbindung aus der YAML zu übernehmen. Ohne Zugangsdaten klappt das nicht und du bekommst eine Reparaturmeldung.
Doku für alle Konfigurationsparameter: https://www.home-assistant.io/integrations/influxdb/
influxdb:
  max_retries: 3
  tags:
    source: HA
  tags_attributes:
    - friendly_name
  default_measurement: state
  exclude:
    entities:
      - zone.home
    domains:
      - persistent_notification
      - person
  include:
    domains:
      - sensor
      - binary_sensor
      - sun
      - light
      - cover
    entities:
      - weather.home
Was die einzelnen Einträge machen:
tags: Alle Werte bekommen den Tagsource: HA, das hilft bei der Organisation der Daten.tags_attributes: Neben der Entitäts-ID wird auch der Anzeigename übertragen, damit findest du deine Sensoren in Grafana deutlich leichter.default_measurement: InfluxDB legt die Daten nach Einheit ab (°C, W, kWh …). Entitäten ohne Einheit landen mitstategesammelt unter „state“, statt dass jede ihr eigenes Measurement bekommt.excludeundinclude: Nicht mit der Bazooka einfach alles speichern, sondern überlegen, was du wirklich auswerten willst. Mit den Domainssensorundbinary_sensorist das meiste Relevante schon dabei. Einzelne Entitäten nimmst du wieweather.homezusätzlich auf. Die Liste ist ein Beispiel, pass sie an dein System an.max_retries: Bei Netzwerkfehlern versucht Home Assistant das Schreiben bis zu dreimal erneut.
Danach unter Einstellungen → Werkzeuge → YAML (früher „Entwicklerwerkzeuge“) die Konfiguration prüfen und Home Assistant neu starten.
Du hast noch den alten Block aus dem Video mit username und password in der configuration.yaml? Dann übernimmt Home Assistant die Verbindung beim Neustart automatisch in die Integration und meldet unter Einstellungen → Reparaturen, dass die YAML-Verbindungsdaten entfernt werden. Nimm dann die Verbindungs-Schlüssel raus (username, password und, falls vorhanden, host, port, database, api_version, ssl), lass den Rest wie oben stehen und starte neu.
Prüfen, ob Daten ankommen
Schau nach dem Neustart unter Einstellungen → System → Protokolle, ob dort Fehler zu InfluxDB auftauchen. Dann in Chronograf links auf Explore und home_assistant.autogen öffnen. Dort siehst du die Measurements nach Einheit, also zum Beispiel °C, kWh oder state, und darunter deine Entitäten. Ist da etwas drin, läuft die Übertragung.
Grafana
Grafana-App installieren
- Im App Store nach Grafana suchen (oder direkt über diesen My-Home-Assistant-Link) und installieren.
- Auf der Info-Seite die Schalter nach Wunsch setzen und die App starten.
- Über die Seitenleiste oder Benutzeroberfläche öffnen aufrufen. Siehst du „502 Bad Gateway“, ist Grafana noch nicht ganz hochgefahren, dann einfach kurz warten.
Über die Seitenleiste meldet dich die App automatisch als Admin an, ein eigenes Login brauchst du dafür nicht.
InfluxDB als Datenquelle in Grafana hinzufügen
- In Grafana über das Menü
Connections → Data sourcesöffnen und eine neue Datenquelle vom Typ InfluxDB hinzufügen. - Query language: InfluxQL.
- URL:
http://a0d7b954-influxdb:8086. Im Video habe ich stattdessen die IP-Adresse von Home Assistant mit Port 8086 genommen, das geht auch. - Database:
home_assistant. - User und Password: dein InfluxDB-Benutzer. Du kannst denselben nehmen wie für Home Assistant oder in Chronograf einen eigenen Benutzer für Grafana anlegen.
- Auf Save & test klicken. Grafana sollte dir jetzt bestätigen, dass die Datenquelle funktioniert.
Danach am besten ein paar Minuten warten, damit überhaupt ein paar Messwerte da sind. Wie du dann Dashboards, Panels und Abfragen baust, zeige ich ausführlich im Video oben.
URL zum Einbetten in Dashboards
Im Grafana-Dashboard oben auf den Teilen-Button klicken und den Link kopieren. Den fügst du in Home Assistant in eine Webseite-Karte ein, zum Beispiel auf einem eigenen Dashboard in der Panel-Ansicht. Hinten an die URL kommen die Parameter für den Zeitraum und den Kiosk-Modus. Der Ingress-Teil und die Dashboard-ID sind bei dir natürlich andere.
Diese Parameter hängst du hinten an die kopierte URL an (Zeitraum: letzter Tag, dazu der Kiosk-Modus ohne Grafana-Menüs):
&from=now-1d&to=now&kiosk=tv
Komplett sieht die URL dann zum Beispiel so aus:
http://XXX.XXX.XXX.XXX:8123/api/hassio_ingress/SsHp2UdJ3E5ag0lSUX0T2EltPUEKPeDsASE1WHR78gk/d/DJm6f304k/heizungsanalyse?orgId=1&from=now-1d&to=now&kiosk=tv
Das klappt nur, wenn du Grafana vorher mindestens einmal über die Seitenleiste geöffnet hast, weil erst dann das Anmelde-Cookie im Browser liegt. Ehrlich gesagt ist die Einbettung über Ingress etwas hakelig. Ich würde die Dashboards weiterhin direkt in Grafana benutzen, dafür ist es gedacht.
Code aus dem Video
Da ich inzwischen so oft danach gefragt wurde, hier die Grafana-Exports der Dashboards als JSON für euch 💙. Natürlich bitte trotzdem das Video anschauen (in Ruhe), da so die Konfiguration, Bedienung sowie Sinn & Zweck klar wird 😉
Danke auch nochmal ganz besonders an alle Kaffeespender die es ermöglichen, dass ich hier so viel Arbeit reinstecke 🙏
So importierst du die Dashboards
- In Grafana
Dashboards → New → Importöffnen, den JSON-Code einfügen und laden. - In den Exports steckt die ID meiner Datenquelle (
JzL_Sa04z). Ersetze sie vor dem Import durch die ID deiner InfluxDB-Datenquelle. Die findest du in der Adresszeile, wenn du die Datenquelle in Grafana öffnest (der letzte Teil nach/datasources/edit/). - Die Abfragen nutzen meine Entitäten, zum Beispiel
vorlauf_hk1,rucklauf_fbhoderaussentemperatur_wetter. Die musst du in den Panels gegen deine eigenen tauschen.
Wenn du Vor- und Rücklauf deiner Heizung selbst messen willst, findest du hier eine Anleitung mit DS18B20-Fühlern am Rohr: Rohr-Temperaturen mit Home Assistant überwachen.
Heizungsanalyse

{
"annotations": {
"list": [
{
"builtIn": 1,
"datasource": {
"type": "grafana",
"uid": "-- Grafana --"
},
"enable": true,
"hide": true,
"iconColor": "rgba(0, 211, 255, 1)",
"name": "Annotations & Alerts",
"target": {
"limit": 100,
"matchAny": false,
"tags": [],
"type": "dashboard"
},
"type": "dashboard"
}
]
},
"description": "",
"editable": true,
"fiscalYearStartMonth": 0,
"graphTooltip": 0,
"id": 2,
"links": [],
"liveNow": false,
"panels": [
{
"datasource": {
"type": "influxdb",
"uid": "JzL_Sa04z"
},
"description": "",
"fieldConfig": {
"defaults": {
"color": {
"mode": "palette-classic"
},
"custom": {
"axisCenteredZero": false,
"axisColorMode": "text",
"axisLabel": "",
"axisPlacement": "auto",
"barAlignment": 0,
"drawStyle": "line",
"fillOpacity": 14,
"gradientMode": "hue",
"hideFrom": {
"legend": false,
"tooltip": false,
"viz": false
},
"insertNulls": false,
"lineInterpolation": "smooth",
"lineStyle": {
"fill": "solid"
},
"lineWidth": 2,
"pointSize": 5,
"scaleDistribution": {
"type": "linear"
},
"showPoints": "auto",
"spanNulls": true,
"stacking": {
"group": "A",
"mode": "none"
},
"thresholdsStyle": {
"mode": "off"
}
},
"mappings": [],
"thresholds": {
"mode": "absolute",
"steps": [
{
"color": "green",
"value": null
},
{
"color": "red",
"value": 80
}
]
},
"unit": "celsius"
},
"overrides": []
},
"gridPos": {
"h": 9,
"w": 12,
"x": 0,
"y": 0
},
"id": 2,
"options": {
"legend": {
"calcs": [],
"displayMode": "list",
"placement": "bottom",
"showLegend": true
},
"tooltip": {
"mode": "single",
"sort": "none"
}
},
"targets": [
{
"alias": "Temperatur Küche",
"datasource": {
"type": "influxdb",
"uid": "JzL_Sa04z"
},
"groupBy": [
{
"params": [
"$__interval"
],
"type": "time"
},
{
"params": [
"null"
],
"type": "fill"
}
],
"measurement": "°C",
"orderByTime": "ASC",
"policy": "default",
"refId": "A",
"resultFormat": "time_series",
"select": [
[
{
"params": [
"value"
],
"type": "field"
},
{
"params": [],
"type": "mean"
}
]
],
"tags": [
{
"key": "entity_id",
"operator": "=",
"value": "lumi_lumi_weather_temperature"
}
]
},
{
"alias": "Temperatur Bad",
"datasource": {
"type": "influxdb",
"uid": "JzL_Sa04z"
},
"groupBy": [
{
"params": [
"$__interval"
],
"type": "time"
},
{
"params": [
"null"
],
"type": "fill"
}
],
"hide": false,
"measurement": "°C",
"orderByTime": "ASC",
"policy": "default",
"refId": "B",
"resultFormat": "time_series",
"select": [
[
{
"params": [
"value"
],
"type": "field"
},
{
"params": [],
"type": "mean"
}
]
],
"tags": [
{
"key": "entity_id",
"operator": "=",
"value": "lumi_lumi_weather_temperature_2"
}
]
},
{
"alias": "Temperatur Wohnzimmer",
"datasource": {
"type": "influxdb",
"uid": "JzL_Sa04z"
},
"groupBy": [
{
"params": [
"$__interval"
],
"type": "time"
},
{
"params": [
"null"
],
"type": "fill"
}
],
"hide": false,
"measurement": "°C",
"orderByTime": "ASC",
"policy": "default",
"refId": "C",
"resultFormat": "time_series",
"select": [
[
{
"params": [
"value"
],
"type": "field"
},
{
"params": [],
"type": "mean"
}
]
],
"tags": [
{
"key": "entity_id",
"operator": "=",
"value": "lumi_lumi_weather_temperature_3"
}
]
}
],
"title": "Temperaturen Wohnung",
"type": "timeseries"
},
{
"datasource": {
"type": "influxdb",
"uid": "JzL_Sa04z"
},
"description": "",
"fieldConfig": {
"defaults": {
"color": {
"mode": "palette-classic"
},
"custom": {
"axisCenteredZero": false,
"axisColorMode": "text",
"axisLabel": "",
"axisPlacement": "auto",
"barAlignment": 0,
"drawStyle": "line",
"fillOpacity": 14,
"gradientMode": "hue",
"hideFrom": {
"legend": false,
"tooltip": false,
"viz": false
},
"insertNulls": false,
"lineInterpolation": "smooth",
"lineStyle": {
"fill": "solid"
},
"lineWidth": 2,
"pointSize": 5,
"scaleDistribution": {
"type": "linear"
},
"showPoints": "auto",
"spanNulls": true,
"stacking": {
"group": "A",
"mode": "none"
},
"thresholdsStyle": {
"mode": "off"
}
},
"mappings": [],
"thresholds": {
"mode": "absolute",
"steps": [
{
"color": "green",
"value": null
},
{
"color": "red",
"value": 80
}
]
},
"unit": "celsius"
},
"overrides": []
},
"gridPos": {
"h": 9,
"w": 12,
"x": 12,
"y": 0
},
"id": 5,
"options": {
"legend": {
"calcs": [],
"displayMode": "list",
"placement": "bottom",
"showLegend": true
},
"tooltip": {
"mode": "single",
"sort": "none"
}
},
"targets": [
{
"alias": "Aussentemperatur Wetterdienst",
"datasource": {
"type": "influxdb",
"uid": "JzL_Sa04z"
},
"groupBy": [
{
"params": [
"$__interval"
],
"type": "time"
},
{
"params": [
"null"
],
"type": "fill"
}
],
"measurement": "°C",
"orderByTime": "ASC",
"policy": "default",
"refId": "A",
"resultFormat": "time_series",
"select": [
[
{
"params": [
"value"
],
"type": "field"
},
{
"params": [],
"type": "mean"
}
]
],
"tags": [
{
"key": "entity_id",
"operator": "=",
"value": "aussentemperatur_wetter"
}
]
}
],
"title": "Umwelt",
"type": "timeseries"
},
{
"datasource": {
"type": "influxdb",
"uid": "JzL_Sa04z"
},
"description": "",
"fieldConfig": {
"defaults": {
"color": {
"mode": "palette-classic"
},
"custom": {
"axisCenteredZero": false,
"axisColorMode": "text",
"axisLabel": "",
"axisPlacement": "auto",
"barAlignment": 0,
"drawStyle": "line",
"fillOpacity": 14,
"gradientMode": "hue",
"hideFrom": {
"legend": false,
"tooltip": false,
"viz": false
},
"insertNulls": false,
"lineInterpolation": "smooth",
"lineStyle": {
"fill": "solid"
},
"lineWidth": 2,
"pointSize": 5,
"scaleDistribution": {
"type": "linear"
},
"showPoints": "auto",
"spanNulls": true,
"stacking": {
"group": "A",
"mode": "none"
},
"thresholdsStyle": {
"mode": "off"
}
},
"mappings": [],
"thresholds": {
"mode": "absolute",
"steps": [
{
"color": "green",
"value": null
},
{
"color": "red",
"value": 80
}
]
},
"unit": "celsius"
},
"overrides": [
{
"matcher": {
"id": "byFrameRefID",
"options": "A"
},
"properties": [
{
"id": "color",
"value": {
"fixedColor": "light-blue",
"mode": "fixed"
}
}
]
},
{
"matcher": {
"id": "byFrameRefID",
"options": "B"
},
"properties": [
{
"id": "color",
"value": {
"fixedColor": "light-red",
"mode": "fixed"
}
}
]
}
]
},
"gridPos": {
"h": 9,
"w": 12,
"x": 0,
"y": 9
},
"id": 3,
"options": {
"legend": {
"calcs": [],
"displayMode": "list",
"placement": "bottom",
"showLegend": true
},
"tooltip": {
"mode": "single",
"sort": "none"
}
},
"targets": [
{
"alias": "Rücklauf FBH",
"datasource": {
"type": "influxdb",
"uid": "JzL_Sa04z"
},
"groupBy": [
{
"params": [
"$__interval"
],
"type": "time"
},
{
"params": [
"null"
],
"type": "fill"
}
],
"measurement": "°C",
"orderByTime": "ASC",
"policy": "default",
"refId": "A",
"resultFormat": "time_series",
"select": [
[
{
"params": [
"value"
],
"type": "field"
},
{
"params": [],
"type": "mean"
}
]
],
"tags": [
{
"key": "entity_id",
"operator": "=",
"value": "rucklauf_fbh"
}
]
},
{
"alias": "Vorlauf FBH",
"datasource": {
"type": "influxdb",
"uid": "JzL_Sa04z"
},
"groupBy": [
{
"params": [
"$__interval"
],
"type": "time"
},
{
"params": [
"null"
],
"type": "fill"
}
],
"hide": false,
"measurement": "°C",
"orderByTime": "ASC",
"policy": "default",
"refId": "B",
"resultFormat": "time_series",
"select": [
[
{
"params": [
"value"
],
"type": "field"
},
{
"params": [],
"type": "mean"
}
]
],
"tags": [
{
"key": "entity_id",
"operator": "=",
"value": "vorlauf_fbh"
}
]
}
],
"title": "Temperaturen FBH",
"type": "timeseries"
},
{
"datasource": {
"type": "influxdb",
"uid": "JzL_Sa04z"
},
"description": "",
"fieldConfig": {
"defaults": {
"color": {
"mode": "palette-classic"
},
"custom": {
"axisCenteredZero": false,
"axisColorMode": "text",
"axisLabel": "",
"axisPlacement": "auto",
"barAlignment": 0,
"drawStyle": "line",
"fillOpacity": 14,
"gradientMode": "hue",
"hideFrom": {
"legend": false,
"tooltip": false,
"viz": false
},
"insertNulls": false,
"lineInterpolation": "smooth",
"lineStyle": {
"fill": "solid"
},
"lineWidth": 2,
"pointSize": 5,
"scaleDistribution": {
"type": "linear"
},
"showPoints": "auto",
"spanNulls": true,
"stacking": {
"group": "A",
"mode": "none"
},
"thresholdsStyle": {
"mode": "off"
}
},
"mappings": [],
"thresholds": {
"mode": "absolute",
"steps": [
{
"color": "green",
"value": null
},
{
"color": "red",
"value": 80
}
]
},
"unit": "celsius"
},
"overrides": [
{
"matcher": {
"id": "byFrameRefID",
"options": "A"
},
"properties": [
{
"id": "color",
"value": {
"fixedColor": "dark-blue",
"mode": "fixed"
}
}
]
},
{
"matcher": {
"id": "byFrameRefID",
"options": "B"
},
"properties": [
{
"id": "color",
"value": {
"fixedColor": "dark-red",
"mode": "fixed"
}
}
]
}
]
},
"gridPos": {
"h": 9,
"w": 12,
"x": 12,
"y": 9
},
"id": 4,
"options": {
"legend": {
"calcs": [],
"displayMode": "list",
"placement": "bottom",
"showLegend": true
},
"tooltip": {
"mode": "single",
"sort": "none"
}
},
"targets": [
{
"alias": "Rücklauf HK1",
"datasource": {
"type": "influxdb",
"uid": "JzL_Sa04z"
},
"groupBy": [
{
"params": [
"$__interval"
],
"type": "time"
},
{
"params": [
"null"
],
"type": "fill"
}
],
"measurement": "°C",
"orderByTime": "ASC",
"policy": "default",
"refId": "A",
"resultFormat": "time_series",
"select": [
[
{
"params": [
"value"
],
"type": "field"
},
{
"params": [],
"type": "mean"
}
]
],
"tags": [
{
"key": "entity_id",
"operator": "=",
"value": "rucklauf_hk1"
}
]
},
{
"alias": "Vorlauf HK1",
"datasource": {
"type": "influxdb",
"uid": "JzL_Sa04z"
},
"groupBy": [
{
"params": [
"$__interval"
],
"type": "time"
},
{
"params": [
"null"
],
"type": "fill"
}
],
"hide": false,
"measurement": "°C",
"orderByTime": "ASC",
"policy": "default",
"refId": "B",
"resultFormat": "time_series",
"select": [
[
{
"params": [
"value"
],
"type": "field"
},
{
"params": [],
"type": "mean"
}
]
],
"tags": [
{
"key": "entity_id",
"operator": "=",
"value": "vorlauf_hk1"
}
]
}
],
"title": "Temperaturen HK1",
"type": "timeseries"
},
{
"datasource": {
"type": "influxdb",
"uid": "JzL_Sa04z"
},
"description": "",
"fieldConfig": {
"defaults": {
"color": {
"mode": "thresholds",
"seriesBy": "last"
},
"custom": {
"axisCenteredZero": false,
"axisColorMode": "text",
"axisLabel": "",
"axisPlacement": "auto",
"barAlignment": 0,
"drawStyle": "line",
"fillOpacity": 14,
"gradientMode": "scheme",
"hideFrom": {
"legend": false,
"tooltip": false,
"viz": false
},
"insertNulls": false,
"lineInterpolation": "smooth",
"lineStyle": {
"dash": [
0,
10
],
"fill": "dot"
},
"lineWidth": 2,
"pointSize": 5,
"scaleDistribution": {
"type": "linear"
},
"showPoints": "auto",
"spanNulls": true,
"stacking": {
"group": "A",
"mode": "none"
},
"thresholdsStyle": {
"mode": "line+area"
}
},
"mappings": [],
"thresholds": {
"mode": "absolute",
"steps": [
{
"color": "red",
"value": null
},
{
"color": "yellow",
"value": 2
},
{
"color": "green",
"value": 4
}
]
},
"unit": "celsius"
},
"overrides": []
},
"gridPos": {
"h": 9,
"w": 12,
"x": 0,
"y": 18
},
"id": 6,
"interval": "5m",
"options": {
"legend": {
"calcs": [],
"displayMode": "list",
"placement": "bottom",
"showLegend": true
},
"tooltip": {
"mode": "single",
"sort": "none"
}
},
"targets": [
{
"alias": "VLFBH",
"datasource": {
"type": "influxdb",
"uid": "JzL_Sa04z"
},
"groupBy": [
{
"params": [
"$__interval"
],
"type": "time"
},
{
"params": [
"null"
],
"type": "fill"
}
],
"hide": false,
"measurement": "°C",
"orderByTime": "ASC",
"policy": "default",
"refId": "B",
"resultFormat": "time_series",
"select": [
[
{
"params": [
"value"
],
"type": "field"
},
{
"params": [],
"type": "mean"
}
]
],
"tags": [
{
"key": "entity_id",
"operator": "=",
"value": "vorlauf_fbh"
}
]
},
{
"alias": "RLFBH",
"datasource": {
"type": "influxdb",
"uid": "JzL_Sa04z"
},
"groupBy": [
{
"params": [
"$__interval"
],
"type": "time"
},
{
"params": [
"null"
],
"type": "fill"
}
],
"measurement": "°C",
"orderByTime": "ASC",
"policy": "default",
"refId": "A",
"resultFormat": "time_series",
"select": [
[
{
"params": [
"value"
],
"type": "field"
},
{
"params": [],
"type": "mean"
}
]
],
"tags": [
{
"key": "entity_id",
"operator": "=",
"value": "rucklauf_fbh"
}
]
}
],
"title": "RL vs VL FBH",
"transformations": [
{
"id": "calculateField",
"options": {
"alias": "Rücklaufsabkühlung FBH",
"binary": {
"left": "VLFBH",
"operator": "-",
"reducer": "sum",
"right": "RLFBH"
},
"mode": "binary",
"reduce": {
"reducer": "sum"
},
"replaceFields": true
}
}
],
"type": "timeseries"
},
{
"datasource": {
"type": "influxdb",
"uid": "JzL_Sa04z"
},
"description": "",
"fieldConfig": {
"defaults": {
"color": {
"mode": "thresholds",
"seriesBy": "last"
},
"custom": {
"axisCenteredZero": false,
"axisColorMode": "text",
"axisLabel": "",
"axisPlacement": "auto",
"barAlignment": 0,
"drawStyle": "line",
"fillOpacity": 14,
"gradientMode": "scheme",
"hideFrom": {
"legend": false,
"tooltip": false,
"viz": false
},
"insertNulls": false,
"lineInterpolation": "smooth",
"lineStyle": {
"dash": [
0,
10
],
"fill": "dot"
},
"lineWidth": 2,
"pointSize": 5,
"scaleDistribution": {
"type": "linear"
},
"showPoints": "auto",
"spanNulls": true,
"stacking": {
"group": "A",
"mode": "none"
},
"thresholdsStyle": {
"mode": "line+area"
}
},
"mappings": [],
"thresholds": {
"mode": "absolute",
"steps": [
{
"color": "red",
"value": null
},
{
"color": "yellow",
"value": 2
},
{
"color": "green",
"value": 4
}
]
},
"unit": "celsius"
},
"overrides": []
},
"gridPos": {
"h": 9,
"w": 12,
"x": 12,
"y": 18
},
"id": 7,
"interval": "5m",
"options": {
"legend": {
"calcs": [],
"displayMode": "list",
"placement": "bottom",
"showLegend": true
},
"tooltip": {
"mode": "single",
"sort": "none"
}
},
"targets": [
{
"alias": "VLHK11",
"datasource": {
"type": "influxdb",
"uid": "JzL_Sa04z"
},
"groupBy": [
{
"params": [
"$__interval"
],
"type": "time"
},
{
"params": [
"null"
],
"type": "fill"
}
],
"hide": false,
"measurement": "°C",
"orderByTime": "ASC",
"policy": "default",
"refId": "B",
"resultFormat": "time_series",
"select": [
[
{
"params": [
"value"
],
"type": "field"
},
{
"params": [],
"type": "mean"
}
]
],
"tags": [
{
"key": "entity_id",
"operator": "=",
"value": "vorlauf_hk1"
}
]
},
{
"alias": "RLHK11",
"datasource": {
"type": "influxdb",
"uid": "JzL_Sa04z"
},
"groupBy": [
{
"params": [
"$__interval"
],
"type": "time"
},
{
"params": [
"null"
],
"type": "fill"
}
],
"measurement": "°C",
"orderByTime": "ASC",
"policy": "default",
"refId": "A",
"resultFormat": "time_series",
"select": [
[
{
"params": [
"value"
],
"type": "field"
},
{
"params": [],
"type": "mean"
}
]
],
"tags": [
{
"key": "entity_id",
"operator": "=",
"value": "rucklauf_hk1"
}
]
}
],
"title": "RL vs VL HK1",
"transformations": [
{
"id": "calculateField",
"options": {
"alias": "Rücklaufsabkühlung HK1",
"binary": {
"left": "VLHK11",
"operator": "-",
"reducer": "sum",
"right": "RLHK11"
},
"mode": "binary",
"reduce": {
"reducer": "sum"
},
"replaceFields": true
}
}
],
"type": "timeseries"
}
],
"refresh": "",
"schemaVersion": 38,
"style": "dark",
"tags": [],
"templating": {
"list": []
},
"time": {
"from": "now-6h",
"to": "now"
},
"timepicker": {},
"timezone": "",
"title": "Heizungsanalyse",
"uid": "DJm6f304k",
"version": 15,
"weekStart": ""
}
Heizungsüberwachung
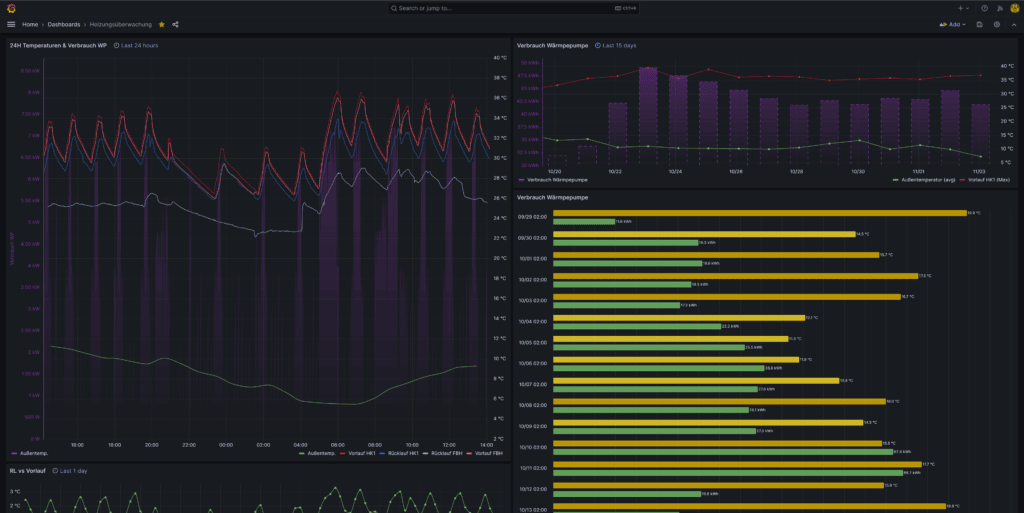
{
"annotations": {
"list": [
{
"builtIn": 1,
"datasource": {
"type": "grafana",
"uid": "-- Grafana --"
},
"enable": true,
"hide": true,
"iconColor": "rgba(0, 211, 255, 1)",
"name": "Annotations & Alerts",
"target": {
"limit": 100,
"matchAny": false,
"tags": [],
"type": "dashboard"
},
"type": "dashboard"
}
]
},
"description": "",
"editable": true,
"fiscalYearStartMonth": 0,
"graphTooltip": 0,
"id": 1,
"links": [],
"liveNow": false,
"panels": [
{
"datasource": {
"type": "influxdb",
"uid": "JzL_Sa04z"
},
"description": "",
"fieldConfig": {
"defaults": {
"color": {
"mode": "palette-classic"
},
"custom": {
"axisCenteredZero": false,
"axisColorMode": "text",
"axisLabel": "",
"axisPlacement": "right",
"barAlignment": 0,
"drawStyle": "line",
"fillOpacity": 0,
"gradientMode": "opacity",
"hideFrom": {
"legend": false,
"tooltip": false,
"viz": false
},
"insertNulls": false,
"lineInterpolation": "smooth",
"lineStyle": {
"fill": "solid"
},
"lineWidth": 1,
"pointSize": 5,
"scaleDistribution": {
"type": "linear"
},
"showPoints": "never",
"spanNulls": true,
"stacking": {
"group": "A",
"mode": "none"
},
"thresholdsStyle": {
"mode": "off"
}
},
"displayName": "Außentemp.",
"mappings": [],
"thresholds": {
"mode": "absolute",
"steps": [
{
"color": "green",
"value": null
}
]
},
"unit": "celsius"
},
"overrides": [
{
"matcher": {
"id": "byFrameRefID",
"options": "Vorlauf HK 1"
},
"properties": [
{
"id": "displayName",
"value": "Vorlauf HK1"
},
{
"id": "color",
"value": {
"fixedColor": "dark-red",
"mode": "fixed"
}
}
]
},
{
"matcher": {
"id": "byFrameRefID",
"options": "Rücklauf HK 1"
},
"properties": [
{
"id": "displayName",
"value": "Rücklauf HK1"
},
{
"id": "color",
"value": {
"fixedColor": "dark-blue",
"mode": "fixed"
}
}
]
},
{
"matcher": {
"id": "byFrameRefID",
"options": "Rücklauf FBH"
},
"properties": [
{
"id": "displayName",
"value": "Rücklauf FBH"
},
{
"id": "color",
"value": {
"fixedColor": "light-blue",
"mode": "fixed"
}
}
]
},
{
"matcher": {
"id": "byFrameRefID",
"options": "Vorlauf FBH"
},
"properties": [
{
"id": "displayName",
"value": "Vorlauf FBH"
},
{
"id": "color",
"value": {
"fixedColor": "light-red",
"mode": "fixed"
}
}
]
},
{
"matcher": {
"id": "byFrameRefID",
"options": "Verbrauch WP"
},
"properties": [
{
"id": "custom.axisLabel",
"value": "Verbrauch WP"
},
{
"id": "unit",
"value": "watt"
},
{
"id": "custom.fillOpacity",
"value": 36
},
{
"id": "custom.lineWidth",
"value": 0
},
{
"id": "color",
"value": {
"fixedColor": "dark-purple",
"mode": "fixed"
}
},
{
"id": "custom.axisPlacement",
"value": "left"
},
{
"id": "custom.axisColorMode",
"value": "series"
}
]
},
{
"matcher": {
"id": "byFrameRefID",
"options": "Außentemperatur Grad"
},
"properties": [
{
"id": "color",
"value": {
"fixedColor": "green",
"mode": "fixed"
}
}
]
}
]
},
"gridPos": {
"h": 28,
"w": 12,
"x": 0,
"y": 0
},
"id": 2,
"options": {
"legend": {
"calcs": [],
"displayMode": "list",
"placement": "bottom",
"showLegend": true
},
"tooltip": {
"mode": "single",
"sort": "none"
}
},
"pluginVersion": "9.2.4",
"targets": [
{
"datasource": {
"type": "influxdb",
"uid": "JzL_Sa04z"
},
"groupBy": [
{
"params": [
"$__interval"
],
"type": "time"
},
{
"params": [
"null"
],
"type": "fill"
}
],
"measurement": "°C",
"orderByTime": "ASC",
"policy": "default",
"refId": "Außentemperatur Grad",
"resultFormat": "time_series",
"select": [
[
{
"params": [
"value"
],
"type": "field"
},
{
"params": [],
"type": "mean"
}
]
],
"tags": [
{
"key": "entity_id",
"operator": "=",
"value": "aussentemperatur_wetter"
}
]
},
{
"datasource": {
"type": "influxdb",
"uid": "JzL_Sa04z"
},
"groupBy": [
{
"params": [
"$__interval"
],
"type": "time"
},
{
"params": [
"null"
],
"type": "fill"
}
],
"hide": false,
"measurement": "°C",
"orderByTime": "ASC",
"policy": "default",
"query": "SELECT mean(\"value\") FROM \"°C\" WHERE (\"entity_id\" = 'vorlauf_hk1') AND $timeFilter GROUP BY time($__interval) fill(null)",
"rawQuery": false,
"refId": "Vorlauf HK 1",
"resultFormat": "time_series",
"select": [
[
{
"params": [
"value"
],
"type": "field"
},
{
"params": [],
"type": "mean"
}
]
],
"tags": [
{
"key": "entity_id",
"operator": "=",
"value": "vorlauf_hk1"
}
]
},
{
"datasource": {
"type": "influxdb",
"uid": "JzL_Sa04z"
},
"groupBy": [
{
"params": [
"$__interval"
],
"type": "time"
},
{
"params": [
"null"
],
"type": "fill"
}
],
"hide": false,
"measurement": "°C",
"orderByTime": "ASC",
"policy": "default",
"refId": "Rücklauf HK 1",
"resultFormat": "time_series",
"select": [
[
{
"params": [
"value"
],
"type": "field"
},
{
"params": [],
"type": "mean"
}
]
],
"tags": [
{
"key": "entity_id",
"operator": "=",
"value": "rucklauf_hk1"
}
]
},
{
"datasource": {
"type": "influxdb",
"uid": "JzL_Sa04z"
},
"groupBy": [
{
"params": [
"$__interval"
],
"type": "time"
},
{
"params": [
"null"
],
"type": "fill"
}
],
"hide": false,
"measurement": "°C",
"orderByTime": "ASC",
"policy": "default",
"query": "SELECT mean(\"value\") FROM \"°C\" WHERE (\"entity_id\" = 'vorlauf_hk1') AND $timeFilter GROUP BY time($__interval) fill(null)",
"rawQuery": false,
"refId": "Rücklauf FBH",
"resultFormat": "time_series",
"select": [
[
{
"params": [
"value"
],
"type": "field"
},
{
"params": [],
"type": "mean"
}
]
],
"tags": [
{
"key": "entity_id",
"operator": "=",
"value": "rucklauf_fbh"
}
]
},
{
"datasource": {
"type": "influxdb",
"uid": "JzL_Sa04z"
},
"groupBy": [
{
"params": [
"$__interval"
],
"type": "time"
},
{
"params": [
"null"
],
"type": "fill"
}
],
"hide": false,
"measurement": "W",
"orderByTime": "ASC",
"policy": "default",
"refId": "Verbrauch WP",
"resultFormat": "time_series",
"select": [
[
{
"params": [
"value"
],
"type": "field"
},
{
"params": [],
"type": "mean"
},
{
"params": [
"alias"
],
"type": "alias"
}
]
],
"tags": [
{
"key": "entity_id",
"operator": "=",
"value": "leistung_warmepumpe"
}
]
},
{
"datasource": {
"type": "influxdb",
"uid": "JzL_Sa04z"
},
"groupBy": [
{
"params": [
"$__interval"
],
"type": "time"
},
{
"params": [
"null"
],
"type": "fill"
}
],
"hide": false,
"measurement": "°C",
"orderByTime": "ASC",
"policy": "default",
"query": "SELECT mean(\"value\") FROM \"°C\" WHERE (\"entity_id\" = 'vorlauf_hk1') AND $timeFilter GROUP BY time($__interval) fill(null)",
"rawQuery": false,
"refId": "Vorlauf FBH",
"resultFormat": "time_series",
"select": [
[
{
"params": [
"value"
],
"type": "field"
},
{
"params": [],
"type": "mean"
}
]
],
"tags": [
{
"key": "entity_id",
"operator": "=",
"value": "vorlauf_fbh"
}
]
}
],
"timeFrom": "24h",
"title": "24H Temperaturen & Verbrauch WP",
"type": "timeseries"
},
{
"datasource": {
"type": "influxdb",
"uid": "JzL_Sa04z"
},
"description": "",
"fieldConfig": {
"defaults": {
"color": {
"mode": "palette-classic"
},
"custom": {
"axisCenteredZero": false,
"axisColorMode": "text",
"axisLabel": "",
"axisPlacement": "right",
"barAlignment": 0,
"drawStyle": "line",
"fillOpacity": 0,
"gradientMode": "none",
"hideFrom": {
"legend": false,
"tooltip": false,
"viz": false
},
"insertNulls": false,
"lineInterpolation": "linear",
"lineWidth": 1,
"pointSize": 5,
"scaleDistribution": {
"type": "linear"
},
"showPoints": "auto",
"spanNulls": false,
"stacking": {
"group": "A",
"mode": "none"
},
"thresholdsStyle": {
"mode": "off"
}
},
"displayName": "Außentemperatur (avg)",
"mappings": [],
"thresholds": {
"mode": "absolute",
"steps": [
{
"color": "super-light-blue",
"value": null
},
{
"color": "blue",
"value": -10
},
{
"color": "dark-blue",
"value": 0
},
{
"color": "light-yellow",
"value": 5
},
{
"color": "light-orange",
"value": 15
},
{
"color": "semi-dark-orange",
"value": 20
},
{
"color": "dark-orange",
"value": 30
},
{
"color": "red",
"value": 35
}
]
},
"unit": "celsius"
},
"overrides": [
{
"matcher": {
"id": "byFrameRefID",
"options": "Verbrauch WP"
},
"properties": [
{
"id": "unit",
"value": "kwatth"
},
{
"id": "custom.lineStyle",
"value": {
"dash": [
10,
10
],
"fill": "dash"
}
},
{
"id": "custom.drawStyle",
"value": "bars"
},
{
"id": "custom.gradientMode",
"value": "opacity"
},
{
"id": "custom.fillOpacity",
"value": 45
},
{
"id": "thresholds",
"value": {
"mode": "absolute",
"steps": [
{
"color": "green",
"value": null
},
{
"color": "#EAB839",
"value": 80
},
{
"color": "red",
"value": 100
}
]
}
},
{
"id": "custom.thresholdsStyle",
"value": {
"mode": "off"
}
},
{
"id": "displayName",
"value": "Verbrauch Wärmpepumpe"
},
{
"id": "custom.axisPlacement",
"value": "left"
},
{
"id": "color",
"value": {
"fixedColor": "dark-purple",
"mode": "fixed"
}
},
{
"id": "custom.axisColorMode",
"value": "series"
}
]
},
{
"matcher": {
"id": "byFrameRefID",
"options": "Vorlauf HK1"
},
"properties": [
{
"id": "displayName",
"value": "Vorlauf HK1 (Max)"
},
{
"id": "color",
"value": {
"fixedColor": "dark-red",
"mode": "fixed",
"seriesBy": "last"
}
}
]
},
{
"matcher": {
"id": "byFrameRefID",
"options": "Außentemperatur"
},
"properties": [
{
"id": "color",
"value": {
"fixedColor": "green",
"mode": "fixed"
}
}
]
}
]
},
"gridPos": {
"h": 10,
"w": 12,
"x": 12,
"y": 0
},
"id": 4,
"interval": "1d",
"options": {
"legend": {
"calcs": [],
"displayMode": "list",
"placement": "bottom",
"showLegend": true
},
"tooltip": {
"mode": "single",
"sort": "none"
}
},
"targets": [
{
"datasource": {
"type": "influxdb",
"uid": "JzL_Sa04z"
},
"groupBy": [
{
"params": [
"$__interval"
],
"type": "time"
},
{
"params": [
"null"
],
"type": "fill"
}
],
"hide": false,
"measurement": "°C",
"orderByTime": "ASC",
"policy": "default",
"refId": "Außentemperatur",
"resultFormat": "time_series",
"select": [
[
{
"params": [
"value"
],
"type": "field"
},
{
"params": [],
"type": "mean"
}
]
],
"tags": [
{
"key": "entity_id",
"operator": "=",
"value": "aussentemperatur_wetter"
}
]
},
{
"datasource": {
"type": "influxdb",
"uid": "JzL_Sa04z"
},
"groupBy": [
{
"params": [
"$__interval"
],
"type": "time"
},
{
"params": [
"null"
],
"type": "fill"
}
],
"hide": false,
"measurement": "°C",
"orderByTime": "ASC",
"policy": "default",
"refId": "Vorlauf HK1",
"resultFormat": "time_series",
"select": [
[
{
"params": [
"value"
],
"type": "field"
},
{
"params": [],
"type": "max"
}
]
],
"tags": [
{
"key": "entity_id",
"operator": "=",
"value": "vorlauf_hk1"
}
]
},
{
"datasource": {
"type": "influxdb",
"uid": "JzL_Sa04z"
},
"groupBy": [
{
"params": [
"$__interval"
],
"type": "time"
},
{
"params": [
"null"
],
"type": "fill"
}
],
"measurement": "kWh",
"orderByTime": "ASC",
"policy": "default",
"query": "SELECT difference(mean(\"value\")) FROM \"kWh\" WHERE (\"entity_id\" = 'gesamtverbrauch_warmepumpe') AND $timeFilter GROUP BY time($__interval) fill(null)",
"rawQuery": false,
"refId": "Verbrauch WP",
"resultFormat": "time_series",
"select": [
[
{
"params": [
"value"
],
"type": "field"
},
{
"params": [],
"type": "mean"
},
{
"params": [],
"type": "difference"
}
]
],
"tags": [
{
"key": "entity_id",
"operator": "=",
"value": "gesamtverbrauch_warmepumpe"
}
]
}
],
"timeFrom": "15d",
"title": "Verbrauch Wärmpepumpe",
"type": "timeseries"
},
{
"datasource": {
"type": "influxdb",
"uid": "JzL_Sa04z"
},
"description": "",
"fieldConfig": {
"defaults": {
"color": {
"mode": "palette-classic"
},
"custom": {
"axisCenteredZero": false,
"axisColorMode": "text",
"axisLabel": "",
"axisPlacement": "auto",
"fillOpacity": 80,
"gradientMode": "scheme",
"hideFrom": {
"legend": false,
"tooltip": false,
"viz": false
},
"lineWidth": 1,
"scaleDistribution": {
"type": "linear"
},
"thresholdsStyle": {
"mode": "off"
}
},
"mappings": [],
"thresholds": {
"mode": "absolute",
"steps": [
{
"color": "green",
"value": null
}
]
},
"unit": "celsius"
},
"overrides": [
{
"matcher": {
"id": "byFrameRefID",
"options": "Außentemperatur"
},
"properties": [
{
"id": "unit",
"value": "celsius"
},
{
"id": "color",
"value": {
"mode": "thresholds"
}
},
{
"id": "thresholds",
"value": {
"mode": "absolute",
"steps": [
{
"color": "super-light-blue",
"value": null
},
{
"color": "blue",
"value": -5
},
{
"color": "dark-blue",
"value": 0
},
{
"color": "super-light-yellow",
"value": 5
},
{
"color": "yellow",
"value": 10
},
{
"color": "dark-yellow",
"value": 15
},
{
"color": "orange",
"value": 20
},
{
"color": "dark-orange",
"value": 25
},
{
"color": "light-red",
"value": 30
},
{
"color": "semi-dark-red",
"value": 35
},
{
"color": "dark-red",
"value": 40
}
]
}
},
{
"id": "displayName",
"value": "Außentemperatur"
},
{
"id": "custom.scaleDistribution",
"value": {
"type": "linear"
}
}
]
},
{
"matcher": {
"id": "byFrameRefID",
"options": "Verbrauch WP"
},
"properties": [
{
"id": "displayName",
"value": "Verbrauch Wärmepumpe"
},
{
"id": "color",
"value": {
"mode": "thresholds"
}
},
{
"id": "thresholds",
"value": {
"mode": "absolute",
"steps": [
{
"color": "green",
"value": null
},
{
"color": "#EAB839",
"value": 80
},
{
"color": "red",
"value": 100
}
]
}
},
{
"id": "unit",
"value": "kwatth"
},
{
"id": "custom.scaleDistribution",
"value": {
"log": 2,
"type": "log"
}
},
{
"id": "custom.axisColorMode",
"value": "text"
}
]
}
]
},
"gridPos": {
"h": 32,
"w": 12,
"x": 12,
"y": 10
},
"hideTimeOverride": true,
"id": 10,
"interval": "1d",
"options": {
"barRadius": 0.05,
"barWidth": 0.82,
"fullHighlight": false,
"groupWidth": 0.7,
"legend": {
"calcs": [],
"displayMode": "list",
"placement": "bottom",
"showLegend": true
},
"orientation": "horizontal",
"showValue": "auto",
"stacking": "none",
"tooltip": {
"mode": "multi",
"sort": "none"
},
"xTickLabelMaxLength": 0,
"xTickLabelRotation": 0,
"xTickLabelSpacing": 100
},
"targets": [
{
"datasource": {
"type": "influxdb",
"uid": "JzL_Sa04z"
},
"groupBy": [
{
"params": [
"$__interval"
],
"type": "time"
},
{
"params": [
"null"
],
"type": "fill"
}
],
"hide": false,
"measurement": "°C",
"orderByTime": "ASC",
"policy": "default",
"refId": "Außentemperatur",
"resultFormat": "time_series",
"select": [
[
{
"params": [
"value"
],
"type": "field"
},
{
"params": [],
"type": "mean"
}
]
],
"tags": [
{
"key": "entity_id",
"operator": "=",
"value": "aussentemperatur_wetter"
}
]
},
{
"datasource": {
"type": "influxdb",
"uid": "JzL_Sa04z"
},
"groupBy": [
{
"params": [
"$__interval"
],
"type": "time"
},
{
"params": [
"null"
],
"type": "fill"
}
],
"measurement": "kWh",
"orderByTime": "ASC",
"policy": "default",
"query": "SELECT difference(mean(\"value\")) FROM \"kWh\" WHERE (\"entity_id\" = 'gesamtverbrauch_warmepumpe') AND $timeFilter GROUP BY time($__interval) fill(null)",
"rawQuery": false,
"refId": "Verbrauch WP",
"resultFormat": "time_series",
"select": [
[
{
"params": [
"value"
],
"type": "field"
},
{
"params": [],
"type": "mean"
},
{
"params": [],
"type": "difference"
}
]
],
"tags": [
{
"key": "entity_id",
"operator": "=",
"value": "gesamtverbrauch_warmepumpe"
}
]
}
],
"timeFrom": "20d",
"timeShift": "15d",
"title": "Verbrauch Wärmpepumpe",
"type": "barchart"
},
{
"datasource": {
"type": "influxdb",
"uid": "JzL_Sa04z"
},
"description": "",
"fieldConfig": {
"defaults": {
"color": {
"mode": "palette-classic"
},
"custom": {
"axisCenteredZero": false,
"axisColorMode": "text",
"axisGridShow": true,
"axisLabel": "",
"axisPlacement": "auto",
"barAlignment": 0,
"drawStyle": "line",
"fillOpacity": 0,
"gradientMode": "opacity",
"hideFrom": {
"legend": false,
"tooltip": false,
"viz": false
},
"insertNulls": false,
"lineInterpolation": "smooth",
"lineStyle": {
"fill": "solid"
},
"lineWidth": 1,
"pointSize": 5,
"scaleDistribution": {
"type": "linear"
},
"showPoints": "auto",
"spanNulls": true,
"stacking": {
"group": "A",
"mode": "none"
},
"thresholdsStyle": {
"mode": "off"
}
},
"displayName": "HK1 (avg)",
"mappings": [],
"thresholds": {
"mode": "absolute",
"steps": [
{
"color": "green",
"value": null
}
]
},
"unit": "celsius"
},
"overrides": []
},
"gridPos": {
"h": 6,
"w": 12,
"x": 0,
"y": 28
},
"hideTimeOverride": false,
"id": 5,
"interval": "3m",
"maxDataPoints": 100,
"options": {
"legend": {
"calcs": [],
"displayMode": "list",
"placement": "bottom",
"showLegend": true
},
"tooltip": {
"mode": "single",
"sort": "none"
}
},
"pluginVersion": "9.2.4",
"targets": [
{
"alias": "VLHK12",
"datasource": {
"type": "influxdb",
"uid": "JzL_Sa04z"
},
"groupBy": [
{
"params": [
"$__interval"
],
"type": "time"
},
{
"params": [
"null"
],
"type": "fill"
}
],
"hide": false,
"measurement": "°C",
"orderByTime": "ASC",
"policy": "default",
"query": "SELECT mean(\"value\") FROM \"°C\" WHERE (\"entity_id\" = 'vorlauf_hk1') AND $timeFilter GROUP BY time($__interval) fill(null)",
"rawQuery": false,
"refId": "Vorlauf HK1",
"resultFormat": "time_series",
"select": [
[
{
"params": [
"value"
],
"type": "field"
},
{
"params": [],
"type": "mean"
}
]
],
"tags": [
{
"key": "entity_id",
"operator": "=",
"value": "vorlauf_hk1"
}
]
},
{
"alias": "RLHK12",
"datasource": {
"type": "influxdb",
"uid": "JzL_Sa04z"
},
"groupBy": [
{
"params": [
"$__interval"
],
"type": "time"
},
{
"params": [
"null"
],
"type": "fill"
}
],
"hide": false,
"measurement": "°C",
"orderByTime": "ASC",
"policy": "default",
"query": "SELECT mean(\"value\") FROM \"°C\" WHERE (\"entity_id\" = 'vorlauf_hk1') AND $timeFilter GROUP BY time($__interval) fill(null)",
"rawQuery": false,
"refId": "Rücklauf HK1",
"resultFormat": "time_series",
"select": [
[
{
"params": [
"value"
],
"type": "field"
},
{
"params": [],
"type": "mean"
}
]
],
"tags": [
{
"key": "entity_id",
"operator": "=",
"value": "rucklauf_hk1"
}
]
}
],
"timeFrom": "1d",
"title": "RL vs Vorlauf",
"transformations": [
{
"id": "calculateField",
"options": {
"alias": "Difference Daily",
"binary": {
"left": "VLHK12",
"operator": "-",
"reducer": "sum",
"right": "RLHK12"
},
"mode": "binary",
"reduce": {
"reducer": "sum"
},
"replaceFields": true
}
}
],
"type": "timeseries"
},
{
"datasource": {
"type": "influxdb",
"uid": "JzL_Sa04z"
},
"description": "",
"fieldConfig": {
"defaults": {
"color": {
"mode": "thresholds"
},
"displayName": "HK1 (live)",
"mappings": [],
"max": 8,
"thresholds": {
"mode": "absolute",
"steps": [
{
"color": "dark-red"
},
{
"color": "#EAB839",
"value": 2
},
{
"color": "dark-green",
"value": 3
}
]
},
"unit": "celsius"
},
"overrides": []
},
"gridPos": {
"h": 7,
"w": 4,
"x": 0,
"y": 34
},
"id": 8,
"interval": "5m",
"maxDataPoints": 100,
"options": {
"orientation": "auto",
"reduceOptions": {
"calcs": [
"lastNotNull"
],
"fields": "",
"values": false
},
"showThresholdLabels": false,
"showThresholdMarkers": true
},
"pluginVersion": "9.2.4",
"targets": [
{
"alias": "VLHK",
"datasource": {
"type": "influxdb",
"uid": "JzL_Sa04z"
},
"groupBy": [
{
"params": [
"$__interval"
],
"type": "time"
},
{
"params": [
"null"
],
"type": "fill"
}
],
"hide": false,
"measurement": "°C",
"orderByTime": "ASC",
"policy": "default",
"query": "SELECT mean(\"value\") FROM \"°C\" WHERE (\"entity_id\" = 'vorlauf_hk1') AND $timeFilter GROUP BY time($__interval) fill(null)",
"rawQuery": false,
"refId": "Vorlauf HK1",
"resultFormat": "time_series",
"select": [
[
{
"params": [
"value"
],
"type": "field"
},
{
"params": [],
"type": "last"
}
]
],
"tags": [
{
"key": "entity_id",
"operator": "=",
"value": "vorlauf_hk1"
}
]
},
{
"alias": "RLHK",
"datasource": {
"type": "influxdb",
"uid": "JzL_Sa04z"
},
"groupBy": [
{
"params": [
"$__interval"
],
"type": "time"
},
{
"params": [
"null"
],
"type": "fill"
}
],
"hide": false,
"measurement": "°C",
"orderByTime": "ASC",
"policy": "default",
"query": "SELECT last(\"value\") FROM \"°C\" WHERE (\"entity_id\" = 'rucklauf_hk1') AND $timeFilter GROUP BY time($__interval) fill(null)",
"rawQuery": false,
"refId": "Rücklauf HK1",
"resultFormat": "time_series",
"select": [
[
{
"params": [
"value"
],
"type": "field"
},
{
"params": [],
"type": "last"
}
]
],
"tags": [
{
"key": "entity_id",
"operator": "=",
"value": "rucklauf_hk1"
}
]
}
],
"timeFrom": "24h",
"title": "RL vs Vorlauf",
"transformations": [
{
"id": "calculateField",
"options": {
"alias": "VLHKLast",
"mode": "reduceRow",
"reduce": {
"include": [
"VLHK"
],
"reducer": "lastNotNull"
}
}
},
{
"id": "calculateField",
"options": {
"alias": "RLHKLast",
"mode": "reduceRow",
"reduce": {
"include": [
"RLHK"
],
"reducer": "lastNotNull"
}
}
},
{
"id": "calculateField",
"options": {
"binary": {
"left": "VLHKLast",
"operator": "-",
"reducer": "sum",
"right": "RLHK"
},
"mode": "binary",
"reduce": {
"reducer": "sum"
},
"replaceFields": true
}
}
],
"type": "gauge"
},
{
"datasource": {
"type": "influxdb",
"uid": "JzL_Sa04z"
},
"description": "",
"fieldConfig": {
"defaults": {
"color": {
"mode": "thresholds"
},
"displayName": "FBH (live)",
"mappings": [],
"max": 8,
"thresholds": {
"mode": "absolute",
"steps": [
{
"color": "dark-red"
},
{
"color": "#EAB839",
"value": 2
},
{
"color": "dark-green",
"value": 3
}
]
},
"unit": "celsius"
},
"overrides": []
},
"gridPos": {
"h": 7,
"w": 4,
"x": 4,
"y": 34
},
"id": 9,
"interval": "5m",
"maxDataPoints": 100,
"options": {
"orientation": "auto",
"reduceOptions": {
"calcs": [
"lastNotNull"
],
"fields": "",
"values": false
},
"showThresholdLabels": false,
"showThresholdMarkers": true
},
"pluginVersion": "9.2.4",
"targets": [
{
"alias": "VLFBH",
"datasource": {
"type": "influxdb",
"uid": "JzL_Sa04z"
},
"groupBy": [
{
"params": [
"$__interval"
],
"type": "time"
},
{
"params": [
"null"
],
"type": "fill"
}
],
"hide": false,
"measurement": "°C",
"orderByTime": "ASC",
"policy": "default",
"query": "SELECT mean(\"value\") FROM \"°C\" WHERE (\"entity_id\" = 'vorlauf_hk1') AND $timeFilter GROUP BY time($__interval) fill(null)",
"rawQuery": false,
"refId": "Vorlauf HK1",
"resultFormat": "time_series",
"select": [
[
{
"params": [
"value"
],
"type": "field"
},
{
"params": [],
"type": "last"
}
]
],
"tags": [
{
"key": "entity_id",
"operator": "=",
"value": "vorlauf_fbh"
}
]
},
{
"alias": "RLFBH",
"datasource": {
"type": "influxdb",
"uid": "JzL_Sa04z"
},
"groupBy": [
{
"params": [
"$__interval"
],
"type": "time"
},
{
"params": [
"null"
],
"type": "fill"
}
],
"hide": false,
"measurement": "°C",
"orderByTime": "ASC",
"policy": "default",
"query": "SELECT last(\"value\") FROM \"°C\" WHERE (\"entity_id\" = 'rucklauf_hk1') AND $timeFilter GROUP BY time($__interval) fill(null)",
"rawQuery": false,
"refId": "Rücklauf HK1",
"resultFormat": "time_series",
"select": [
[
{
"params": [
"value"
],
"type": "field"
},
{
"params": [],
"type": "last"
}
]
],
"tags": [
{
"key": "entity_id",
"operator": "=",
"value": "rucklauf_fbh"
}
]
}
],
"timeFrom": "24h",
"title": "RL vs Vorlauf",
"transformations": [
{
"id": "calculateField",
"options": {
"alias": "VLFBHLast",
"mode": "reduceRow",
"reduce": {
"include": [
"VLFBH"
],
"reducer": "lastNotNull"
},
"replaceFields": false
}
},
{
"id": "calculateField",
"options": {
"alias": "RLFBHLast",
"mode": "reduceRow",
"reduce": {
"include": [
"RLFBH"
],
"reducer": "lastNotNull"
}
}
},
{
"id": "calculateField",
"options": {
"alias": "DifferenceFBH",
"binary": {
"left": "VLFBHLast",
"operator": "-",
"reducer": "sum",
"right": "RLFBHLast"
},
"mode": "binary",
"reduce": {
"reducer": "sum"
},
"replaceFields": true
}
}
],
"type": "gauge"
},
{
"datasource": {
"type": "influxdb",
"uid": "JzL_Sa04z"
},
"description": "",
"fieldConfig": {
"defaults": {
"color": {
"mode": "thresholds"
},
"displayName": "Wärmepumpe (live)",
"mappings": [],
"min": -1,
"thresholds": {
"mode": "absolute",
"steps": [
{
"color": "green"
},
{
"color": "#EAB839",
"value": 4000
},
{
"color": "red",
"value": 7000
}
]
},
"unit": "watt"
},
"overrides": []
},
"gridPos": {
"h": 7,
"w": 4,
"x": 8,
"y": 34
},
"id": 11,
"interval": "1",
"options": {
"orientation": "auto",
"reduceOptions": {
"calcs": [
"lastNotNull"
],
"fields": "",
"values": false
},
"showThresholdLabels": false,
"showThresholdMarkers": true
},
"pluginVersion": "9.2.4",
"targets": [
{
"datasource": {
"type": "influxdb",
"uid": "JzL_Sa04z"
},
"groupBy": [
{
"params": [
"$__interval"
],
"type": "time"
},
{
"params": [
"null"
],
"type": "fill"
}
],
"hide": false,
"measurement": "W",
"orderByTime": "ASC",
"policy": "default",
"query": "SELECT mean(\"value\") FROM \"°C\" WHERE (\"entity_id\" = 'vorlauf_hk1') AND $timeFilter GROUP BY time($__interval) fill(null)",
"rawQuery": false,
"refId": "Vorlauf HK1",
"resultFormat": "time_series",
"select": [
[
{
"params": [
"value"
],
"type": "field"
},
{
"params": [],
"type": "last"
}
]
],
"tags": [
{
"key": "entity_id",
"operator": "=",
"value": "leistung_warmepumpe"
}
]
}
],
"timeFrom": "24h",
"title": "Verbrauch",
"transformations": [],
"type": "gauge"
}
],
"refresh": "5m",
"schemaVersion": 38,
"style": "dark",
"tags": [],
"templating": {
"list": []
},
"time": {
"from": "now-30d",
"to": "now"
},
"timepicker": {
"hidden": true,
"refresh_intervals": [
"5s",
"10s",
"30s",
"1m",
"5m",
"15m",
"30m",
"1h",
"2h",
"1d"
],
"time_options": [
"5m",
"15m",
"1h",
"6h",
"12h",
"24h",
"2d",
"7d",
"30d"
],
"type": "timepicker"
},
"timezone": "browser",
"title": "Heizungsüberwachung",
"uid": "d5lnDaAVk",
"version": 57,
"weekStart": "monday"
}
Fazit
Nun hast du alle nötigen Informationen, um so richtig mit der Langzeitdatenspeicherung von Home Assistant in InfluxDB zu starten und diese anschließend mit Grafana auszuwerten.
Denn für mich geht es im Smart Home immer um Komfortoptimierung oder Kostenersparnis. Dabei verlasse ich mich nie auf mein Bauchgefühl, sondern treffe Fakten & datenbasierte Entscheidungen, was ohne meine Dashboards nicht möglich wäre.
Wie genau das geht, habe ich ja bereits bis zum Abwinken im Video gezeigt 🙌
Und falls dir für den Anfang die Bordmittel reichen: Für Strom, Wasser und Gas kommst du mit dem Energie-Dashboard und der Langzeitstatistik schon sehr weit, alles dazu im Strom-, Wasser- & Gas-Megabeitrag.
Wenn du Fragen oder Anmerkungen hast, zögere nicht, sie mir unten in den Kommentaren mitzuteilen und ich werde mein Bestes tun, um dir zu helfen. Vielen Dank fürs Lesen!








Hallo Simon, was für ein langes Video. Vielen Dank für deine Arbeit. Leider bin ich schon bei Minute 15:10 Uhr hängen geblieben. Mein Grafana sagt mir zwar dass die datasource arbeitet, aber es werden keine “measurements” gefunden. Und ich habe lange gewartet. Was habe ich falsch gemacht? Oder wie kann ich prüfen wo der Fehler liegt.
Gruß Jens
Bin ich der einzige Depp, der das nicht hin bekommt?
Hi Community, danke für die Aufnahme hier im Forum. Passend zum letzten Post, kann ich sagen, dass es wohl ein wenig dauert bis man das ansatzweise versteht, wie das Zusammenspiel zwischen allen Komponenten hinbekommt. Bei mir funktioniert es nun auch ansatzweise, was ich allerdings nicht hinbekomme, ist die Darstellung der Entitäten meiner Heizungsthermostate. Diese werden zwar angezeigt, aber ich habe es nicht hinbekommen die Entität im Grafana oder der InfluxDB zu finden. Alle aktuellen Temperaturen werden unter climate.thermostat_ angezeigt, aber scheinbar nicht geloggt. Hab zwar einige Beiträge gelesen, aber nicht verstanden warum ich Einträge in der Configuration.yaml machen muss, bzw. welche. Wäre für jeden Ansatz dankbar. Gruß Totti
Hallo - danke für das tolle Video mit dem im HA und influxdb und grafana auf einem Dell Wyse 7050 super zum laufen bekommen habe.
seit 2 Tagen nun kann ich Grafana nicht mehr nutzen. Er hat wohl im Core vom HA Updates gemacht und auch Grafana hat den Sprung auf 9.0 und 9.0.1 gemacht.
Lt. Logs ist die influxdb richtig gestartet und auch im Grafana log
msg=“Update check succeeded” duration=211.883109ms
[11:35:19] INFO: Starting NGINX…
logger=plugin.grafana-image-renderer t=2023-07-09T11:35:20.90285968+02:00 level=warn msg=“Plugin process is running with elevated privileges. This is not recommended”
sollte alles richtig sein.
Hab das addon schon deinstalliert - neu gestartet - neu installiert.
All the Same.
In Add-Ons ist Grafana ausgegraut; wenn ich in Add-Ons auf Starten klicke dreht sich der Kreis zu Tode.
wenn ich in der Seitenleiste auf Grafana springe sagt er mir, dass Add-On sei nicht gestartet. Wenn ich es dann von dort aus starte sagt er:
“The add-on is starting, this can take some time…”…
und dann
“Add-on läuft nicht. Möchtest du es jetzt starten?”
Help - i need somebody´s Help…
Im HA Add-on Store wird ja lediglich das - heute - 9.0.1er angeboten. Bei Grafana selber sind die schon bei 9.1 - 9.5 und 10.X -
Hi, hast du es mittlerweile hinbekommen oder brauchst du noch Hilfe? Ich habe das Tutorial gerade umgesetzt und bei mir hat es einwandfrei funktioniert.
Hast du die configuration.yaml richtig bearbeitet?
LG Max